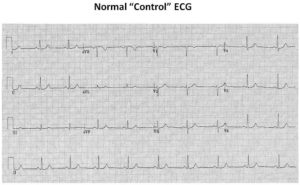
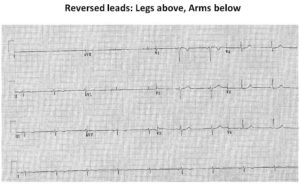
Figures 1 and 2 are from a normal control. The tracing is normal in 1 and the leads reversed in 2 so that the arm leads are now on the feet and the leg leads are attached to the arms. Lead I looks at the legs and not the arms and its isoelectric appearance not surprising.
I see about two examples of this per month.
If you don’t, then you are not looking hard enough!


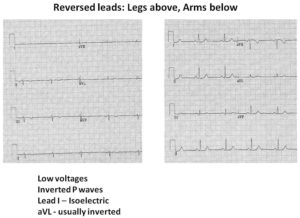
Figure 3 is a comparison of the lead positions with the classical features listed below.

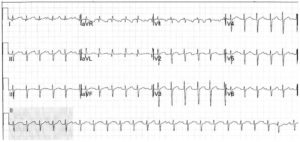
The ECG should be repeated as important pathology may be missed. For example, the rhythm in figure 4 puzzled us and we eventually went with a supraventricular tachycardia, despite a consistent irregularity and possible p waves in V6. The isoelectric lead I made us ask for a repeat (figure 5). The P waves now emerge and the diagnosis is sinus tachycardia and atrial ectopics


Assoc Prof Harry Mond


